
 |
 |
 |
 |
 |
 |
 |
Image Contrast Evaluation ICEMASK™
This reticle provides a set of test structures that vary image contrast without varying pitch.Ā Depending on the exposure process, image contrasts from 10% to 95% are achievable.Ā The reticle helps you:
-
Find the Center of Focus using your device's target pitch.
-
Find the Imaging Bias for your lithography process.
-
Determine MEEF dependence on image contrast.
-
Determine Line Edge Roughness dependence on image contrast.
-
Determine the effect of image contrast on Scatterometric Signals.
Center of Focus
With this reticle, pitch can be set for the most critical binary or weak PSM target.Ā Because the test structures have the same pitch, they will sample the lens in the same way as the target feature.Ā Consistent sampling improves the correlation of setup to fabrication.Ā
How
it works: Within limits defined by the resist, each contrast module will point
to a common center of focus. Lower contrast images will show the center of
focus more clearly than higher contrast images.Ā The method works by finding
the focus setting for the lowest contrast image that prints after sizing the
target feature. Unlike some other test methods, it can be used with any appropriate
exposure tool set-up.
Back
to top
This reticle helps you determine the imaging bias of your lithography process (resist, process, pattern transfer) using fixed pitch variable contrast test structures. Understanding the imaging bias of a resist is difficult to do with multiple pitch features because lens aberrations distort the data.Ā Sampling the lens in the same way with various contrast images minimizes aberration noise.Ā
How
it works: During a focus exposure test, bias can be monitored against image
contrast. Then using numerical analysis that relates the aerial image to the
resist images, the imaging bias of a resist can be estimated.
Back
to top
As the industry images smaller and smaller features, the degrading image contrast adversely affects the resist--variations in feature size on the mask are amplified on the wafer.ĀThis phenomenon is known as the mask error enhancement factor (MEEF).Ā
How
it works: This test mask makes it possible to study the same diffraction pattern
position with images from 10% to 95% contrast and accurately map how the image
size changes for a given exposure conditions, resist, resist process, substrate
conditions and pattern transfer.Ā Subsequent analysis can then relates this
data to MEEF.
Back to top
Image
contrast affects the smoothness of a developed resist image. As feature size
decreases, line-edge roughness can interfere with accurate metrology and hurt
device performance. It is desirable to have a resist and resist process that
does not exhibit sensitivity to contrast variation.Ā This test pattern makes
it possible to screen resists for line-edge-roughness using standard exposure
tools and set-ups.Ā
Back to top
Scatterometric
in-line metrology is being developed for improved process control of the imaging
process.ĀThe
fixed lens sampling and the variable contrast features of the LER reticle
makes it an ideal test vehicle for scatterometric studies, thereby decreasing
noise in the developmental process and decreasing time to production.
Back to top
Test Pattern
Pitch specification will depend on the exposure tool.Ā We recommend 500 nm structures for best results using 248 nm exposures and NA greater than 0.57.Ā If the reticle is to be used for detailed lens mapping, then other pitches will be added to ensure proper lens sampling.
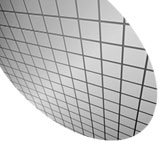
The mask consists of more than fifty contrast modules plus four calibration modules.Ā The current design has sixty-six contrast modules.Ā Some of these are redundant contrasts that supply an internal crosscheck of the test.Ā Each contrast case uses pitches oriented both horizontally and vertically.Ā
Each set of contrast modules is placed on a regular grid with roughly two millimeter spacing across the full field of the reticle. We anticipate that the center fields will be the primary ones used for LER tests, and the other fields will help with lens mapping of focus tolerances.
Extending
beyond measurements that are typical within the mask fabrication industry,
plate metrology also will consist of additional specialized tests using the
Zeiss AIMs tool.Ā These tests provide information about the aerial image of
each contrast module, including the image contrast and normalized-image-log-slope.Ā
Such thorough testing increases the cost of the reticle, but it is crucial
for plate to be calibrated as an MEEF, LER or imaging bias test vehicle.
Back to top
Test Pattern Metrology Description
The
primary metrology for all of these tests is the top-down low voltage SEM.Ā
We recommended using a 500 nm pitch for the MEEF and LER experiments, as with
this pitch a wide range of contrast (from around 10% to 90%) can be designed
for exposure tools of numerical aperture greater than 0.57 at 248 nm.Ā Also,
500 nm pitch makes it possible to use atomic force microscopy if desired.Ā
With smaller pitches, the AFM probe size is too large to measure any profile
except the sides of a test array.Ā To maintain the contrast range with other
exposure conditions use the normalized pitch of the current test mask to choose
another pitch.Ā The only restrictions that apply are that the design must
meet the limitations of the reticle fabrication process.
Back to top
The curve of image contrast for different cases was achieved using PROLITH/2 simulation of sixty-six modified line features for a 500-nm pitch imaged with a 0.68 numerical aperture, 0.7 partial coherence and 248-nm exposure. The contrast ranges from 10% to 95% and is typical of what can be designed for most exposure systems.
ICEMASK™
is a collaborative project with 
Contact us for more information about ICEMASK.
|
© 2002 Petersen Advanced Lithography, Inc. |